人口ピラミッド
地域単位、年単位の人口ピラミッドデータを返します。
GET api/v1/population/composition/pyramidデータ提供年
1980-2045年(5年毎)実績値は2020年まで、それ以降は推計値
RESAS対象マップ
人口マップ > 人口構成
- ※ リンク先のグラフ表示の際のパラメータは、すべて初期設定の値を使用しています。
parameters
| Name | Description | Required |
|---|---|---|
| prefCode | 都道府県コード | true |
| cityCode |
市区町村コード 「すべての市区町村」を選択する場合は「-」を送ります。 |
true |
| yearLeft |
年度1(左側) 1980-2045年(5年毎) |
true |
| yearRight |
年度2(右側) 1980-2045年(5年毎) |
true |
| addArea |
追加エリアコード 他地域と合算した値を取得する際に使用するパラメータです。 「addArea=都道府県コード_市区町村コード」の形式で指定します。 複数指定する場合は「addArea=1_01100,13_13101」などのように、「,」 で各地域のパラメータを区切ります。 都道府県単位で指定する場合、「addArea=1_,13_」の形式で指定します。 最大10個指定でき、11個以上送られてきた場合はステータスコード400を返します。 「cityCode」で「すべての市区町村」(-)を選択した場合、addAreaで合算されるのは、都道府県単位の数値となります。 また、「cityCode」でいずれかの市区町村(13101など)を選択した場合、addAreaで合算されるのは、市区町村単位の数値となります。 |
-
※
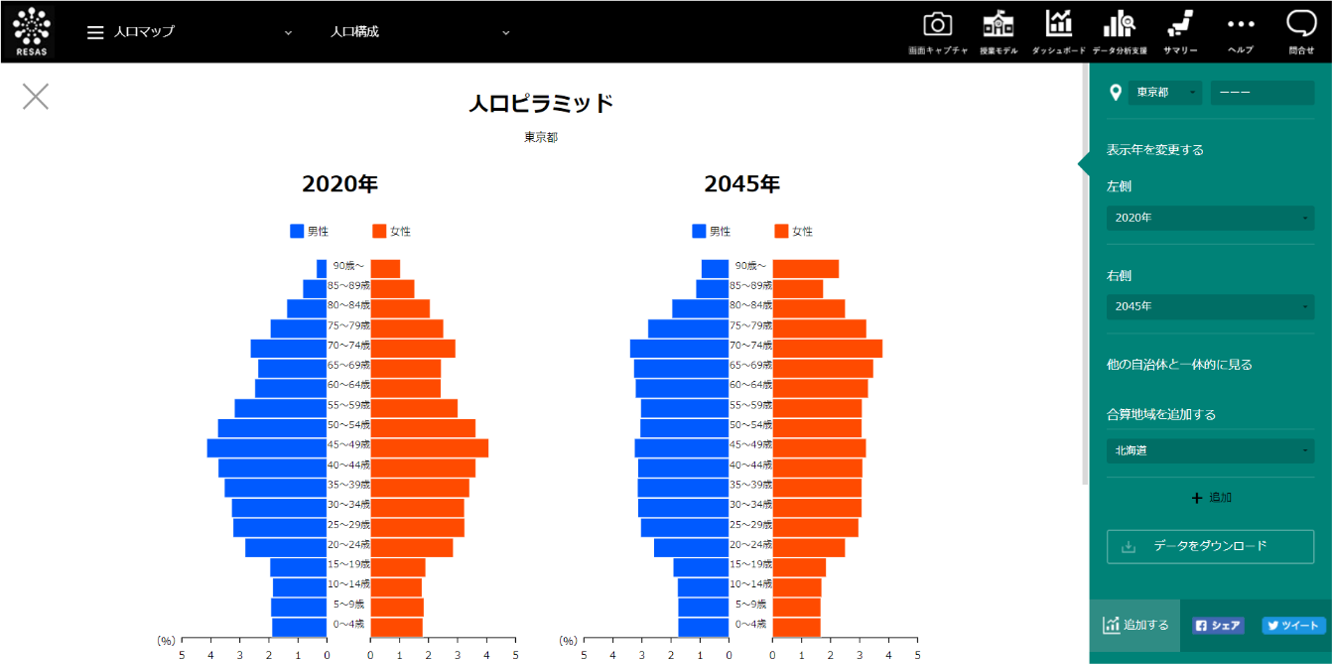
yearLeft、yearRightについて
RESASで提供している人口ピラミッド画面では下記の通り、左右に分けて比較表示を行っています。
yearLeftは左側、yearRightは右側を指し、APIではそれぞれ取得したい年度を指定して値を取得することができます。
responses
| Name | Description |
|---|---|
| /result/yearLeft/year | yearLeftで指定された年 |
| /result/yearLeft/oldAgeCount | 65歳以上の老年人口(人) |
| /result/yearLeft/oldAgePercent | 65歳以上の老年人口(パーセント) |
| /result/yearLeft/middleAgeCount | 15歳~64歳の生産年齢人口(人) |
| /result/yearLeft/middleAgePercent | 15歳~64歳の生産年齢人口(パーセント) |
| /result/yearLeft/newAgeCount | 0歳~14歳の年少人口(人) |
| /result/yearLeft/newAgePercent | 0歳~14歳の年少人口(パーセント) |
| /result/yearLeft/data/class | 年齢階級 |
| /result/yearLeft/data/man | 男性人口(人) |
| /result/yearLeft/data/manPercent | 男性人口(パーセント) |
| /result/yearLeft/data/woman | 女性人口(人) |
| /result/yearLeft/data/womanPercent | 女性人口(パーセント) |
| /result/yearRight/year | yearRightで指定された年 |
| /result/yearRight/oldAgeCount | 老年人口(人). 老年人口 : 65歳以上 |
| /result/yearRight/oldAgePercent | 老年人口(パーセント). 老年人口 : 65歳以上 |
| /result/yearRight/middleAgeCount | 生産年齢人口(人). 生産年齢人口 : 15歳~64歳 |
| /result/yearRight/middleAgePercent | 生産年齢人口(パーセント). 生産年齢人口 : 15歳~64歳 |
| /result/yearRight/newAgeCount | 年少人口(人). 年少人口 : 0歳~14歳 |
| /result/yearRight/newAgePercent | 年少人口(パーセント). 年少人口 : 0歳~14歳 |
| /result/yearRight/data/class | 年齢階級 |
| /result/yearRight/data/man | 男性人口(人) |
| /result/yearRight/data/manPercent | 男性人口(パーセント) |
| /result/yearRight/data/woman | 女性人口(人) |
| /result/yearRight/data/womanPercent | 女性人口(パーセント) |
sample
GET https://opendata.resas-portal.go.jp/api/v1/population/composition/pyramid?cityCode=11362&yearRight=1980&prefCode=11&yearLeft=2030{
"message": null,
"result": {
"yearLeft": {
"year": 2030,
"oldAgeCount": 3212,
"oldAgePercent": 42,
"middleAgeCount": 3693,
"middleAgePercent": 48,
"newAgeCount": 705,
"newAgePercent": 9,
"data": [{
"class": "0~4歳",
"man": 104,
"manPercent": 1.37,
"woman": 99,
"womanPercent": 1.3
}, {
"class": "5~9歳",
"man": 120,
"manPercent": 1.58,
"woman": 109,
"womanPercent": 1.43
}, {
"class": "10~14歳",
"man": 143,
"manPercent": 1.88,
"woman": 130,
"womanPercent": 1.71
}, {
"class": "15~19歳",
"man": 144,
"manPercent": 1.89,
"woman": 139,
"womanPercent": 1.83
}, {
"class": "20~24歳",
"man": 129,
"manPercent": 1.7,
"woman": 114,
"womanPercent": 1.5
}, {
"class": "25~29歳",
"man": 114,
"manPercent": 1.5,
"woman": 131,
"womanPercent": 1.72
}, {
"class": "30~34歳",
"man": 137,
"manPercent": 1.8,
"woman": 116,
"womanPercent": 1.52
}, {
"class": "35~39歳",
"man": 134,
"manPercent": 1.76,
"woman": 116,
"womanPercent": 1.52
}, {
"class": "40~44歳",
"man": 185,
"manPercent": 2.43,
"woman": 150,
"womanPercent": 1.97
}, {
"class": "45~49歳",
"man": 211,
"manPercent": 2.77,
"woman": 218,
"womanPercent": 2.86
}, {
"class": "50~54歳",
"man": 277,
"manPercent": 3.64,
"woman": 225,
"womanPercent": 2.96
}, {
"class": "55~59歳",
"man": 330,
"manPercent": 4.34,
"woman": 305,
"womanPercent": 4.01
}, {
"class": "60~64歳",
"man": 257,
"manPercent": 3.38,
"woman": 261,
"womanPercent": 3.43
}, {
"class": "65~69歳",
"man": 284,
"manPercent": 3.73,
"woman": 262,
"womanPercent": 3.44
}, {
"class": "70~74歳",
"man": 296,
"manPercent": 3.89,
"woman": 310,
"womanPercent": 4.07
}, {
"class": "75~79歳",
"man": 341,
"manPercent": 4.48,
"woman": 376,
"womanPercent": 4.94
}, {
"class": "80~84歳",
"man": 304,
"manPercent": 3.99,
"woman": 339,
"womanPercent": 4.45
}, {
"class": "85~89歳",
"man": 155,
"manPercent": 2.04,
"woman": 216,
"womanPercent": 2.84
}, {
"class": "90歳~",
"man": 101,
"manPercent": 1.33,
"woman": 228,
"womanPercent": 3
}]
},
"yearRight": {
"year": 1980,
"oldAgeCount": 1550,
"oldAgePercent": 12,
"middleAgeCount": 8360,
"middleAgePercent": 65,
"newAgeCount": 2906,
"newAgePercent": 22,
"data": [{
"class": "0~4歳",
"man": 460,
"manPercent": 3.59,
"woman": 420,
"womanPercent": 3.28
}, {
"class": "5~9歳",
"man": 541,
"manPercent": 4.22,
"woman": 551,
"womanPercent": 4.3
}, {
"class": "10~14歳",
"man": 469,
"manPercent": 3.66,
"woman": 465,
"womanPercent": 3.63
}, {
"class": "15~19歳",
"man": 466,
"manPercent": 3.64,
"woman": 434,
"womanPercent": 3.39
}, {
"class": "20~24歳",
"man": 330,
"manPercent": 2.57,
"woman": 370,
"womanPercent": 2.89
}, {
"class": "25~29歳",
"man": 437,
"manPercent": 3.41,
"woman": 449,
"womanPercent": 3.5
}, {
"class": "30~34歳",
"man": 518,
"manPercent": 4.04,
"woman": 469,
"womanPercent": 3.66
}, {
"class": "35~39歳",
"man": 411,
"manPercent": 3.21,
"woman": 385,
"womanPercent": 3
}, {
"class": "40~44歳",
"man": 389,
"manPercent": 3.04,
"woman": 368,
"womanPercent": 2.87
}, {
"class": "45~49歳",
"man": 425,
"manPercent": 3.32,
"woman": 450,
"womanPercent": 3.51
}, {
"class": "50~54歳",
"man": 452,
"manPercent": 3.53,
"woman": 480,
"womanPercent": 3.75
}, {
"class": "55~59歳",
"man": 377,
"manPercent": 2.94,
"woman": 508,
"womanPercent": 3.96
}, {
"class": "60~64歳",
"man": 300,
"manPercent": 2.34,
"woman": 342,
"womanPercent": 2.67
}, {
"class": "65~69歳",
"man": 230,
"manPercent": 1.79,
"woman": 298,
"womanPercent": 2.33
}, {
"class": "70~74歳",
"man": 188,
"manPercent": 1.47,
"woman": 237,
"womanPercent": 1.85
}, {
"class": "75~79歳",
"man": 124,
"manPercent": 0.97,
"woman": 172,
"womanPercent": 1.34
}, {
"class": "80~84歳",
"man": 84,
"manPercent": 0.66,
"woman": 117,
"womanPercent": 0.91
}, {
"class": "85~89歳",
"man": 28,
"manPercent": 0.22,
"woman": 50,
"womanPercent": 0.39
}, {
"class": "90歳~",
"man": 7,
"manPercent": 0.05,
"woman": 15,
"womanPercent": 0.12
}]
}
}
}